Growth patterns are fundamental concepts in mathematics and economics that help us understand how quantities change over time. This article focuses on the comparison between linear and exponential growth, particularly highlighting how an increase of 10% each year exemplifies exponential growth. In the modern world, understanding these concepts is vital for making informed decisions, whether in business, finance, or even personal development.
In this comprehensive guide, we will explore the definitions of linear and exponential growth, provide visual representations through graphs, and discuss their real-world applications. By the end of this article, you will have a clear understanding of how these two types of growth differ and why they matter.
Additionally, we will delve into the implications of a consistent 10% increase per year, illustrating the power of exponential growth over time. This knowledge is not only beneficial for academic purposes but also crucial for practical applications in various fields. Let’s dive in.
Table of Contents
Definition of Linear and Exponential Growth
Growth can be described in various ways, but the two most common forms are linear and exponential. Understanding these definitions is crucial for analyzing data trends and making predictions.
Linear Growth
Linear growth occurs when a quantity increases by a constant amount over equal intervals of time. In mathematical terms, it can be represented by the equation:
y = mx + b
Where:
- y = the final quantity
- m = the constant rate of growth
- x = the time period
- b = the initial value
This means that if you start with a specific value and add a fixed amount each year, the growth is linear.
Exponential Growth
Exponential growth, on the other hand, occurs when a quantity increases by a fixed percentage over equal intervals of time. This can be represented by the formula:
y = a(1 + r)^t
Where:
- y = the final amount
- a = the initial amount
- r = the growth rate (in decimal form)
- t = time
Exponential growth is characterized by rapid increases that become more pronounced as time progresses.
Understanding Linear Growth
Linear growth can be easily understood as a straight line on a graph. Each year, the quantity increases by the same amount, resulting in a constant slope. Here are some key points to consider:
- Predictability: Since the growth is constant, it is easy to predict future values.
- Applications: Commonly seen in scenarios like fixed salary increments or annual savings.
- Graphical Representation: The line remains straight, indicating a steady increase.
Understanding Exponential Growth
Exponential growth, in contrast, can be visualized as a curve that steepens over time. Here’s what you need to know:
- Acceleration: The rate of growth increases as time passes, leading to significant changes in quantity.
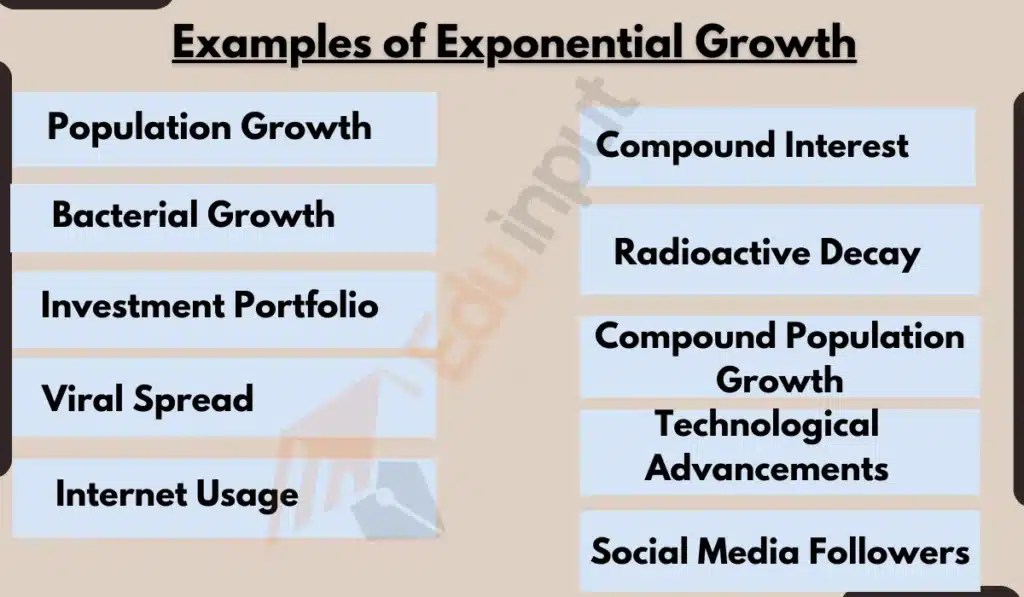
- Real-World Examples: Often seen in populations, investments, and technology advancements.
- Graphical Representation: The curve becomes steeper, showing a rapid increase in value.
The Impact of a 10% Increase Each Year
Now, let’s focus on a scenario where a quantity increases by 10% each year. This is a classic example of exponential growth. To illustrate, consider an initial investment of $1,000. After several years, the value would grow as follows:
- Year 1: $1,000 + ($1,000 * 0.10) = $1,100
- Year 2: $1,100 + ($1,100 * 0.10) = $1,210
- Year 3: $1,210 + ($1,210 * 0.10) = $1,331
- Year 4: $1,331 + ($1,331 * 0.10) = $1,464.10
- Year 5: $1,464.10 + ($1,464.10 * 0.10) = $1,610.51
As you can see, the amount increases significantly each year, demonstrating the power of compounding growth.
Graphs: Visualizing Growth Types
Visual representation of data is essential for understanding growth patterns. Below are sample graphs illustrating both linear and exponential growth:
- Linear Growth Graph: A straight line showing constant increases.
- Exponential Growth Graph: A curve that steepens, indicating rapid increases.
Graphing software or tools like Excel can help in creating these visualizations for better comprehension.
Real-World Applications of Growth Patterns
Understanding linear and exponential growth has practical implications across various fields:
- Finance: Investment growth and interest calculations.
- Demographics: Population studies and resource management.
- Technology: Predicting growth in user base or data consumption.
These applications highlight the importance of recognizing growth patterns to make informed decisions.
Statistical Data Supporting Growth Concepts
Research and statistical data provide a solid foundation for understanding growth patterns:
- According to the World Bank, global GDP has shown exponential growth over the last century.
- In finance, investments that compound annually at 10% can double in value approximately every 7 years, showcasing exponential growth.
- Population studies reveal that certain species can exhibit exponential growth under ideal conditions.
These statistics reinforce the significance of recognizing and applying growth concepts in real-world scenarios.
Conclusion and Key Takeaways
In summary, understanding the differences between linear and exponential growth is crucial for making informed decisions in various fields. A consistent increase, such as 10% each year, highlights the power of exponential growth over time, leading to significant changes in quantity.
As you reflect on the information presented, consider how these concepts apply to your own life, whether in finance, career development, or personal growth.
We invite you to share your thoughts in the comments below, and feel free to explore other articles on our site for more insights into growth dynamics and their applications.
Final Thoughts
Thank you for reading! We hope this article has provided you with valuable insights into linear and exponential growth. Remember, understanding these concepts can empower you to make better decisions in both your personal and professional life. We look forward to your return for more informative content.
ncG1vNJzZmivp6x7rLHLpbCmp5%2Bnsm%2BvzqZmm6efqMFuxc6uqWarlaR8sLzToqanZWJitq%2Bv0Z6YrJ1dl8ZufY9mnJqbmGLGpq3RpaCnnZGneqK6w2acsaifo7KvwMiao2afoqTEtbSMoKmaqJipxrGxjaGrpqQ%3D