The standard normal table, also known as the Z-table, is a vital tool in statistics that helps us understand the distribution of data. This table allows us to find the probability that a statistic is less than or equal to a given z-score, which is essential in various fields, including psychology, finance, and quality control. In this article, we will delve into the intricacies of the standard normal table, its applications, and how to interpret z-scores effectively.
Understanding the concept of z-scores and the standard normal distribution is crucial for anyone working with statistics. The z-score represents the number of standard deviations a data point is from the mean, and the standard normal table provides the probabilities associated with these z-scores. By grasping these concepts, you will be better equipped to analyze data and make informed decisions based on statistical evidence.
Throughout this article, we will explore the various aspects of the standard normal table, including its structure, how to use it, and the significance of z-scores in statistical analysis. Whether you are a student, a professional, or simply someone interested in learning more about statistics, this comprehensive guide will equip you with the knowledge you need to navigate the complexities of the standard normal table.
Table of Contents
What is the Standard Normal Table?
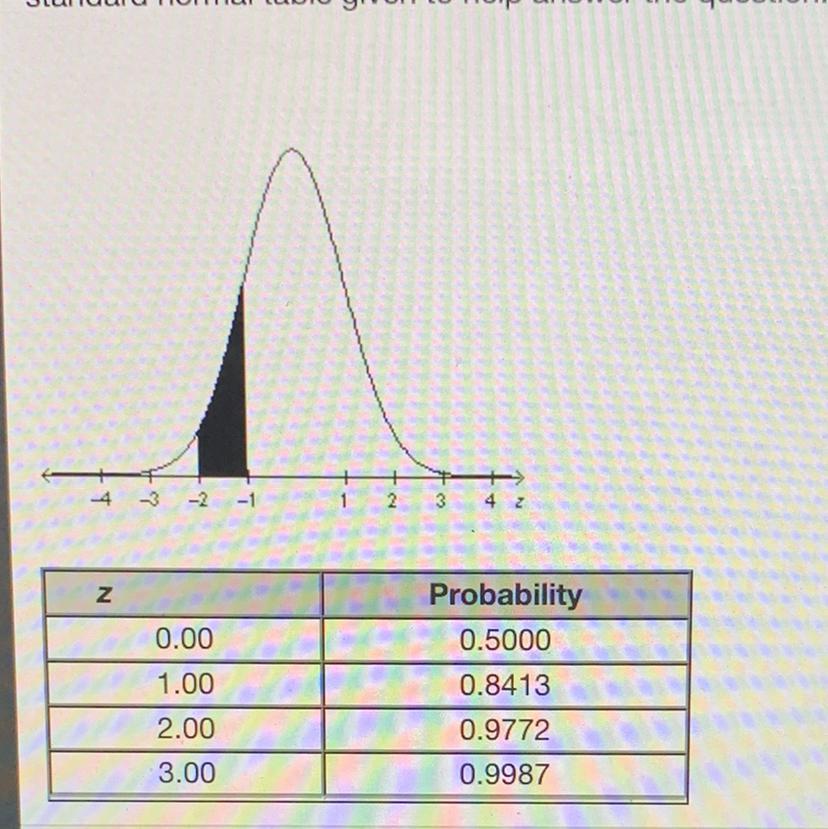
The standard normal table is a mathematical table used to find the probabilities associated with z-scores in a standard normal distribution. A standard normal distribution is a special case of the normal distribution where the mean is 0 and the standard deviation is 1. The table provides the area (or probability) to the left of a given z-score. This means that if you have a z-score of 1.96, the table will tell you the probability that a randomly selected value from the distribution is less than or equal to that z-score.
Understanding Z-Scores
A z-score is calculated using the formula:
z = (X - μ) / σ
- X = the value in question
- μ = the mean of the population
- σ = the standard deviation of the population
This formula helps standardize different data points, allowing statisticians to compare scores from different distributions. A z-score can be positive or negative, indicating whether the value is above or below the mean.
Interpreting Z-Scores
Here are some key interpretations of z-scores:
- A z-score of 0 indicates that the data point is exactly at the mean.
- A positive z-score indicates that the data point is above the mean.
- A negative z-score indicates that the data point is below the mean.
- The further away the z-score is from 0, the more unusual the data point is.
How to Use the Z-Table
Using the z-table involves a few simple steps:
Example of Using the Z-Table
For instance, if you calculate a z-score of 1.5, you would look up 1.5 in the z-table. Suppose the table indicates a probability of 0.9332. This means that there is a 93.32% chance that a randomly selected value is less than or equal to that z-score.
Applications of Z-Scores
Z-scores have numerous applications across various fields:
- Psychology: In psychological testing, z-scores can help normalize test scores for comparison.
- Finance: Investors use z-scores to assess the risk associated with stocks and investment portfolios.
- Quality Control: In manufacturing, z-scores help determine whether a product meets quality standards based on production data.
Common Misconceptions about Z-Scores
Despite their usefulness, several misconceptions surround z-scores:
- Many believe that a higher z-score always indicates a better outcome, but this is not necessarily true, as it depends on the context.
- Some think that z-scores can only be calculated for normally distributed data; however, they can be used for any distribution as long as you know the mean and standard deviation.
Example Calculations Using Z-Scores
Let’s work through a practical example to illustrate the concept:
Suppose a class has a mean test score of 75 with a standard deviation of 10. If a student scores 85, we can calculate the z-score as follows:
z = (85 - 75) / 10 = 1.0
Referring to the z-table, we find that a z-score of 1.0 corresponds to a probability of 0.8413. This indicates that approximately 84.13% of students scored below this student.
Summary and Conclusion
In summary, the standard normal table is an essential tool for understanding z-scores and their implications in statistical analysis. We have covered what the standard normal table is, how to calculate and interpret z-scores, and their applications across various fields. By mastering these concepts, you can enhance your data analysis skills and improve your decision-making processes.
We encourage you to leave a comment below if you have any questions or share this article with others who might find it helpful. Additionally, don't hesitate to explore other articles on our website for more insights into statistical methods.
Further Reading
For more in-depth information about z-scores and statistical analysis, consider checking out the following resources:
ncG1vNJzZmivp6x7rLHLpbCmp5%2Bnsm%2BvzqZmm6efqMFuxc6uqWarlaR8sbvRraCopl2ks27Ax55krKyRo7GivsNmpaiqnZa5bsDAm6OeZZKaubDDjK2mZqCVob1urc2srp6qXam1pnnQrpysrJmku27GjaGrpqQ%3D